Measurement & Forecasting

  • Home
  • Measurement & Forecasting

Forecasting for promises that settle over time

When your business issues a coupon, a voucher, a gift balance, a policy or a care plan, it makes a promise whose ending arrives weeks or months later — redeemed or expired, claimed or lapsed, retained or quietly gone. We are the measurement & forecasting team for those promises: we forecast how the unfinished ones end, measure what your campaigns actually caused, and put a defensible number on what you owe. Everything you issue has a half-life — we measure it.

Our edge is rigour. Since 2017 we have built the data and measurement infrastructure that demanding teams rely on. The methods are standard and battle-tested — survival analysis from clinical trials, holdout design from a century of direct marketing — and the models we fit are always personalized to your program and your data. No vanity numbers: forecasts with error bars, backtested against what actually happened, from pipelines a sceptical reviewer can walk end to end.

We are a fit for any business whose value settles over time: offer and incentive programs (coupon books, vouchers, points balances, gift credit), insurers watching policy lapse and claims development, and healthcare or subscription programs watching retention and adherence. If you hold an event log and a question about how it ends, we can answer it — with or without a data team of your own.

measurement and forecasting image
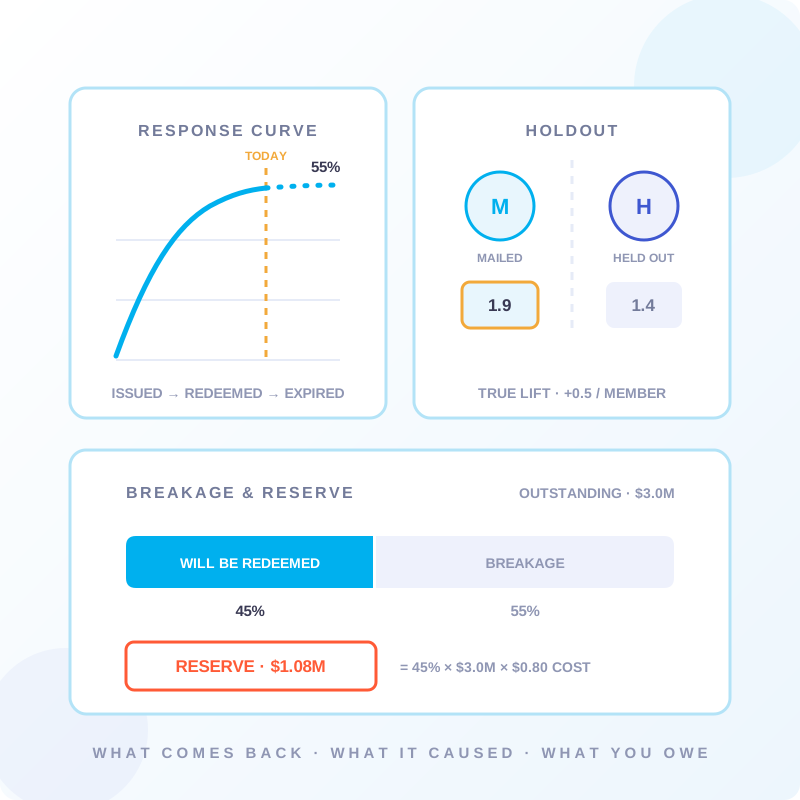
response curve with forecast, holdout lift and breakage & reserve illustration

The four questions we answer

  • What will come back, and when? - redemption and claims forecasting built on survival analysis: cohort curves learned from your event history price the outcomes still in flight, week by week, so cost and capacity are known before the window closes.
  • What did the campaign actually cause? - incrementality measured against properly designed holdouts, not before/after charts: the lift your mailing, offer or outreach created net of what would have happened anyway, with honest error bars.
  • What do we owe? - breakage and reserve estimation for issued offers and balances: the ultimate redemption rate, the accrual it implies and the payout schedule — reproducible, backtested and documented to the standard a finance review demands.
  • Who is quietly leaving? - churn and lapse prediction from leak-free, point-in-time features: the members, policyholders or patients going silent, scored early enough that an intervention can still change the ending.

Four ways to work with us

  • Fully managed on our infrastructure - no data team of your own? Send us your event data and we run the whole measurement and forecasting cycle on our own infrastructure — forecasts, lift readouts, reserve exhibits and dashboards delivered back every cycle, with nothing for you to host or operate.
  • Embedded with your in-house team - already have data people? We slot in alongside your team to add the forecasting and causal-measurement capacity most teams are missing — survival models, holdout design and the pipelines that make the numbers trustworthy.
  • Measurement audit & advisory - keeping it in-house? We design the method — holdout rules, forecasting approach, reserve assumptions — then review and backtest your numbers, so your team acts on real signal instead of opinion.
  • Infrastructure & pipelines - we stand up the event ledgers, forecasting pipelines, models and dashboards inside your own environment — reproducible and gated end to end — then hand them over for your team to own and run.
forecast dashboard
data pipeline review image

Numbers that survive scrutiny

  • Reconciliation gates - every pipeline stage proves its totals against the source before anything downstream runs: issued equals issued, every record in exactly one state, allocations summing to the cent. A check that fails stops the run — it never just logs a warning.
  • Rolling backtests - we rewind to past dates, forecast with only what was knowable then, and score against what actually happened. Actual-over-expected is tracked per segment, every cycle — so you see the method’s accuracy before you bet on it.
  • Uncertainty, always - every forecast ships with a confidence band, and thin evidence gets a wide one. A point estimate without a range is a promise nobody can keep, so we never publish one bare.
  • A changelog for every number - when an estimate moves between cycles, we publish why: how much is new data, how much is audience mix, how much is us re-estimating. Immutable, reproducible runs make every published figure traceable to its exact inputs, code and assumptions.
Let’s Get Started

Ready to know how it ends?

We start from the event data you already have, build the forecasts and measurements that answer the four questions, and back every number with backtests and error bars — so your next decision rests on evidence, not gut feel.

forecast dashboard image
Blog

Recent Posts

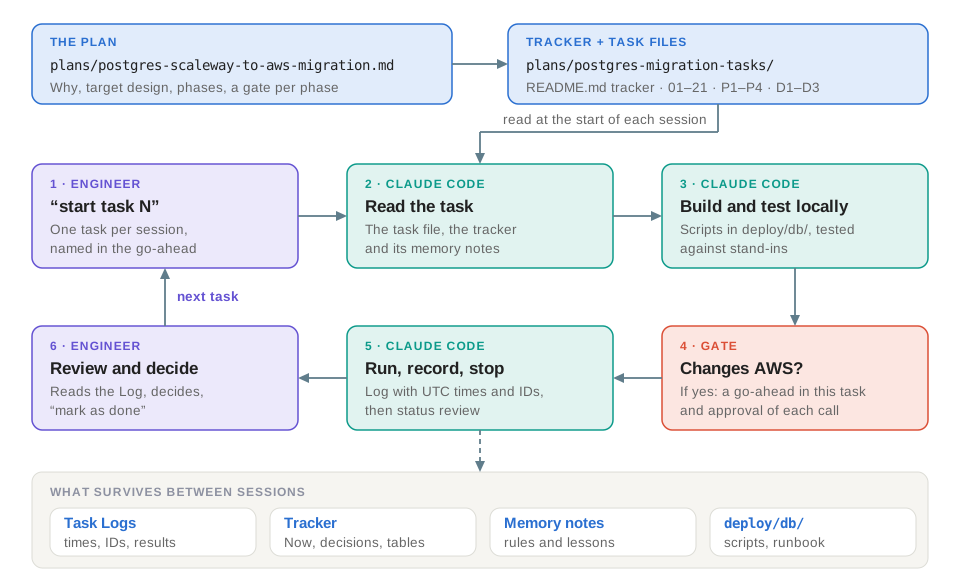
How to Run a Production Database Migration with an AI Agent: Task Files, Review Gates and Claude Code on AWS Image
  • Sebastian Brestin
  • Software Engineer
  • 02 Oct 2026

How to Run a Production Databas…

We moved production PostgreSQL from Scaleway to AWS with Claude Code doing the work and an engineer reviewing each step. Task files, review gates and…

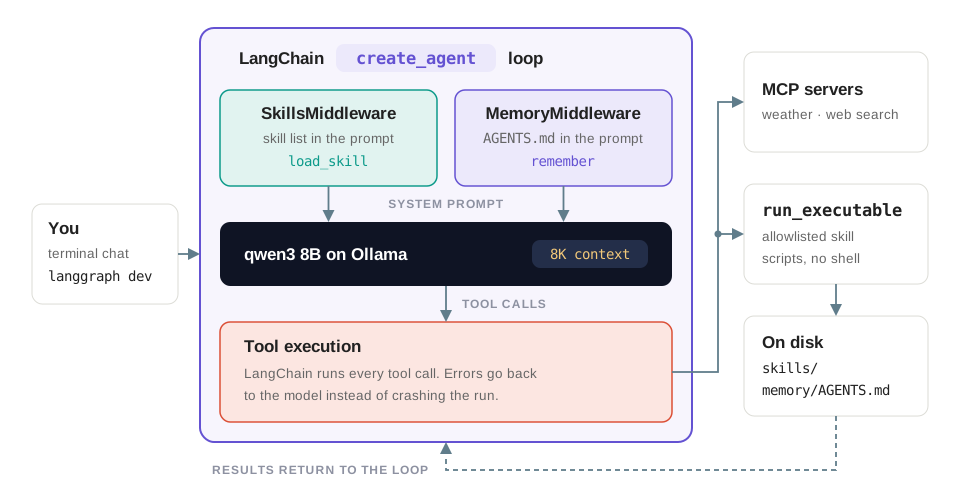
How to Build an AI Agent Harness for a Local LLM: Skills, Memory and Guardrails with LangChain, Ollama + MCP Image
  • Sebastian Brestin
  • Software Engineer
  • 22 Sep 2026

How to Build an AI Agent Harnes…

Turn a local LLM tool-calling loop into a reliable AI agent. Add Claude-style skills, long-term memory, safe script execution and tracing with LangCh…

How to Build an AI Agent with Local LLM and Tool Calling: Ollama + MCP Integration Guide Image
  • Sebastian Brestin
  • Software Engineer
  • 10 Feb 2026

How to Build an AI Agent with L…

When implementing LLM solutions for enterprise, one of the biggest challenges is enabling AI models to access real-time data and execute actions. The…