How to Run a Production Databas…
We moved production PostgreSQL from Scaleway to AWS with Claude Code doing the work and an engineer reviewing each step. Task files, review gates and…


No data team of your own? Send us your event data and we run the whole measurement and forecasting cycle on our own infrastructure — forecasts, lift readouts, reserve exhibits and dashboards delivered back every cycle.
We stand up the event ledgers, forecasting pipelines, models and dashboards inside your own environment — reproducible and quality-gated end to end — then hand it all over for your team to own and operate.
Already have a data team? We embed alongside it — adding the forecasting and causal-measurement capacity most teams are missing: survival models, holdout design and the pipelines that make every number trustworthy.
Keeping it in-house? We design the method — holdout rules, forecasting approach, reserve assumptions — then review and backtest your numbers so your team acts on real signal instead of opinion.

Qwertee is a measurement & forecasting team based in Cluj-Napoca (Romania). Since 2017 we have built the data and measurement infrastructure that demanding teams rely on. The models and algorithms that run on top are always personalized to the client’s own needs — your event data, your program, your assumptions, designed for you alone.
No vanity metrics — just forecasts with error bars, lift measured against real holdouts, and numbers backtested against what actually happened. We work with businesses whose promises settle over time — offer and incentive programs, insurers, patient and subscription programs — and give them numbers they can defend.


We build the full measurement and forecasting layer — from your raw event logs, through survival and hazard models of how each cohort develops, to the forecasts, lift readouts and reserve exhibits your team acts on every cycle.


Ignilife is a digital preventive healthcare platform. We wished to accelerate our roadmap in order to deploy faster our B2B service infrastructure to market. To succeed, we chose to outsource part of our development. We decided to work with Qwertee for the quality of the team and their reactivity. After already four completed sprints, I can testify that we are fully satisfied with the quality level of the development and the deadline compliance. Qwertee became very quickly a reliable partner with whom we wish to continue the relationship.


We start from the event data you already have, then build the forecasts, lift measurements and dashboards that answer what will come back, what it caused and what you owe — so your next decision rests on evidence, not gut feel.

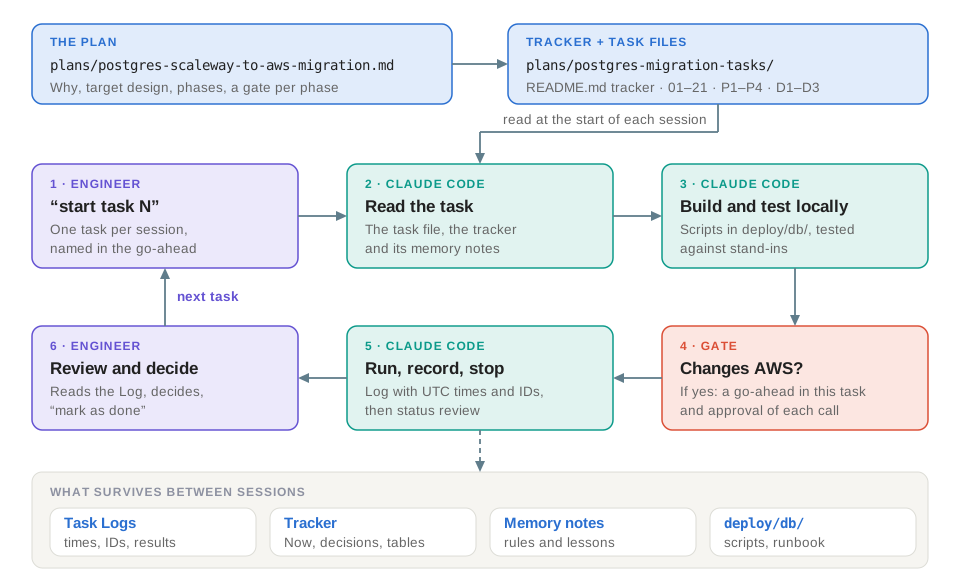
We moved production PostgreSQL from Scaleway to AWS with Claude Code doing the work and an engineer reviewing each step. Task files, review gates and…
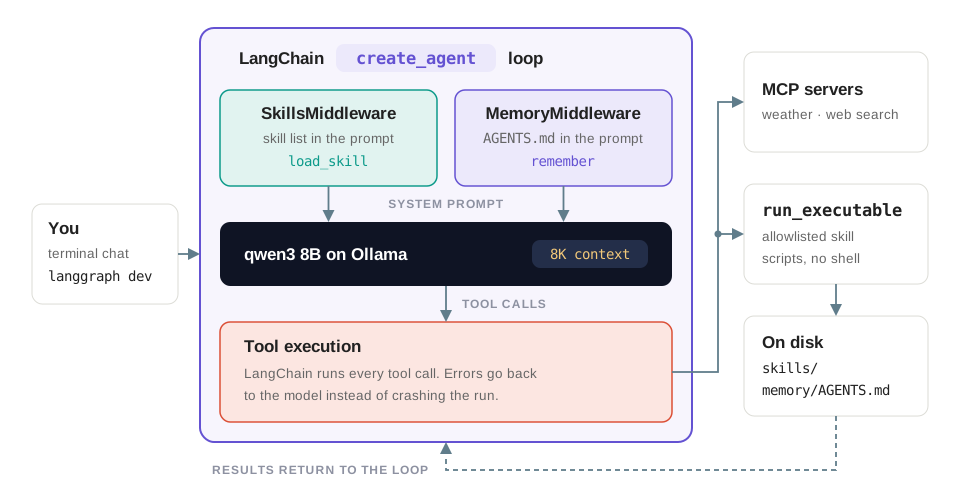
Turn a local LLM tool-calling loop into a reliable AI agent. Add Claude-style skills, long-term memory, safe script execution and tracing with LangCh…

When implementing LLM solutions for enterprise, one of the biggest challenges is enabling AI models to access real-time data and execute actions. The…

Subscribe To Our Newsletter. We’ll Send Email Notification Everytime We Release A New Article Or Upgrade Our Services.
2017-2026 Qwertee Technology. All Rights Reserved.